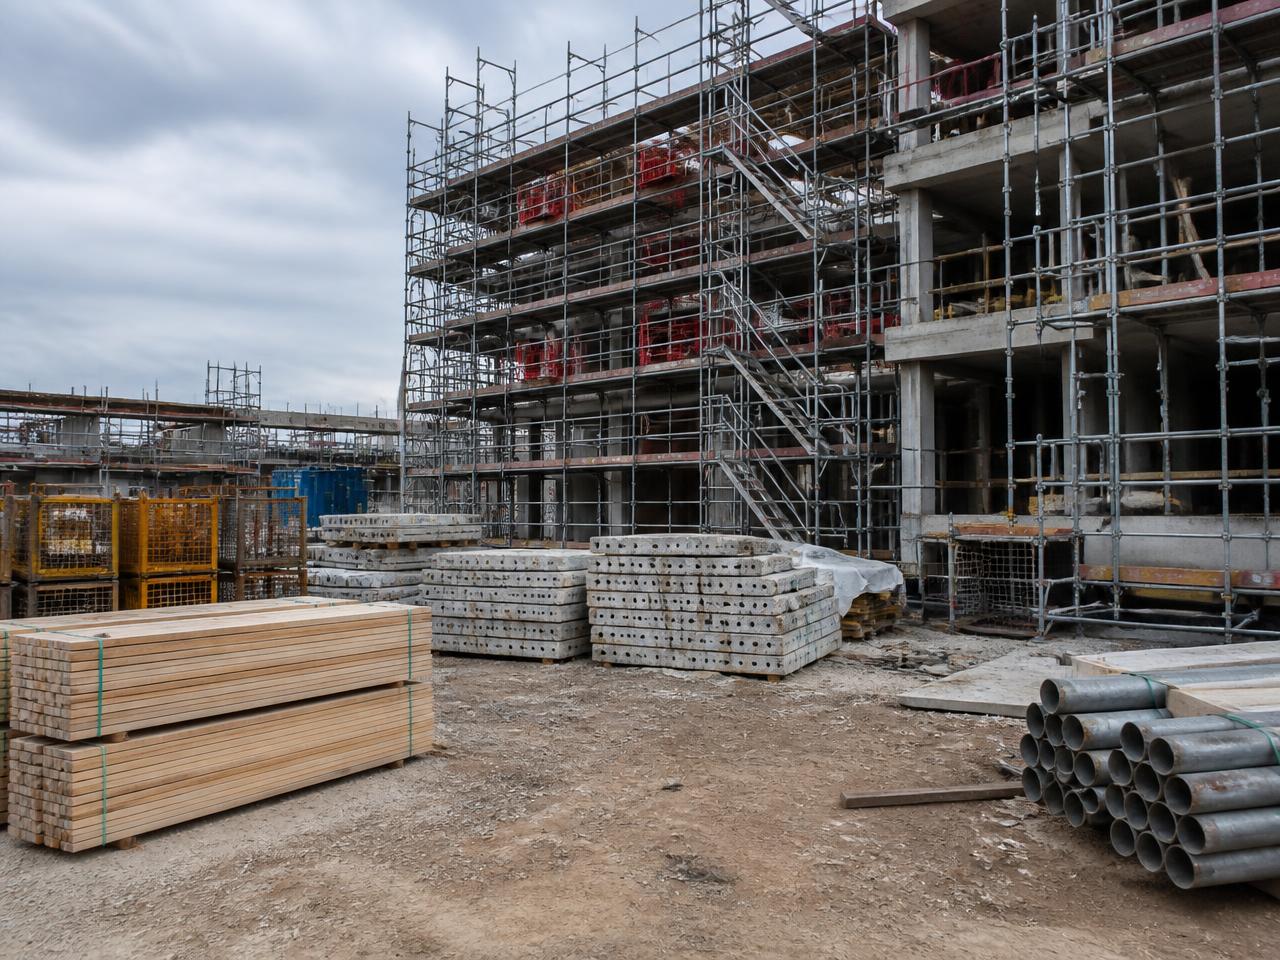
Site progress, equipment and materials documented over time.
Weekly
visual progress record
Dated
evidence for disputes
Any phone
no site hardware
What goes wrong today
The change happens long before anyone sees it.
- Progress disputes come down to whose memory is better.
- Tools and materials disappear between visits.
- Site diaries are text; nobody can see what actually changed.
Example
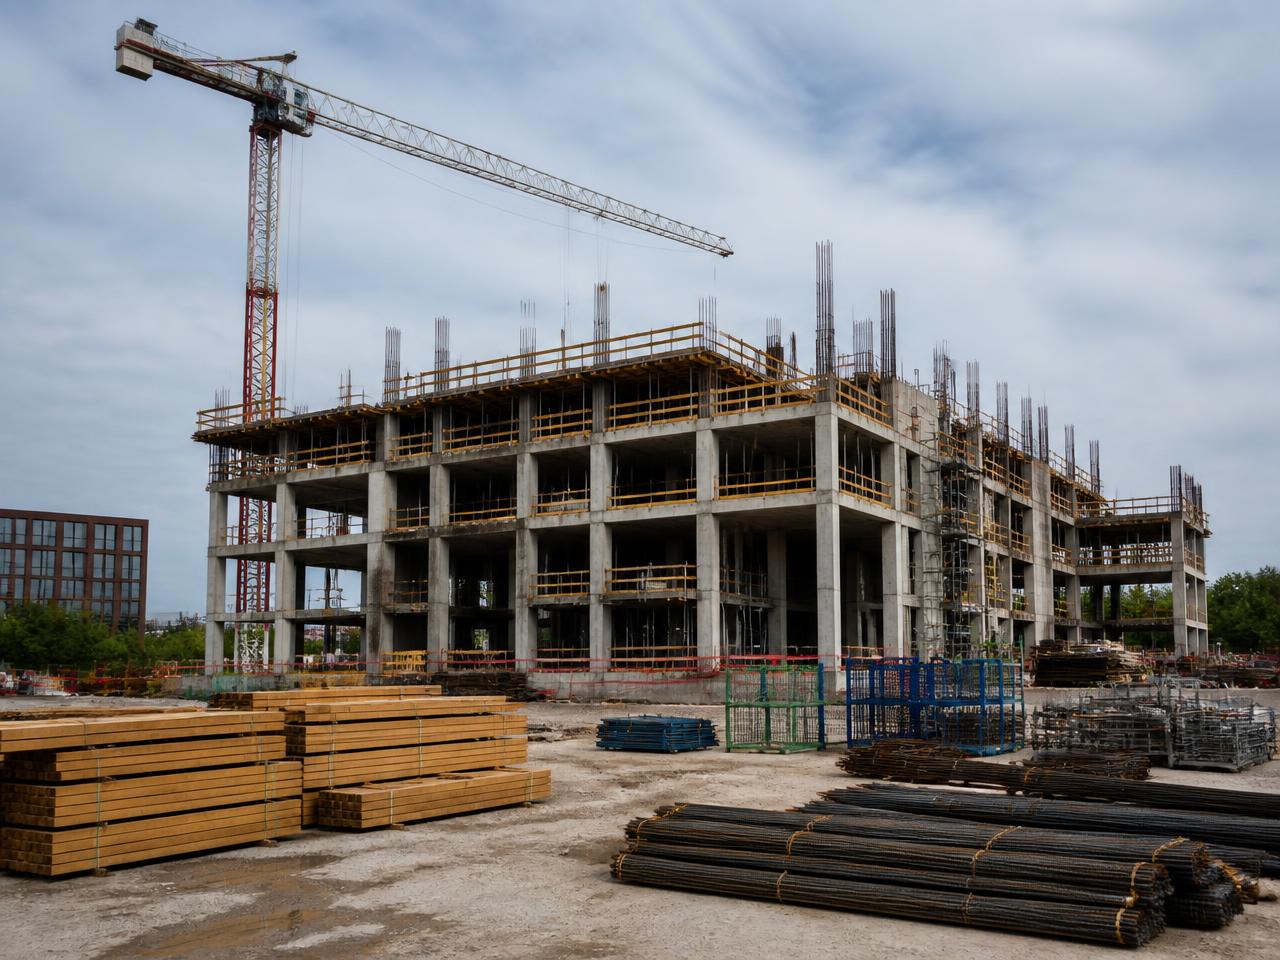
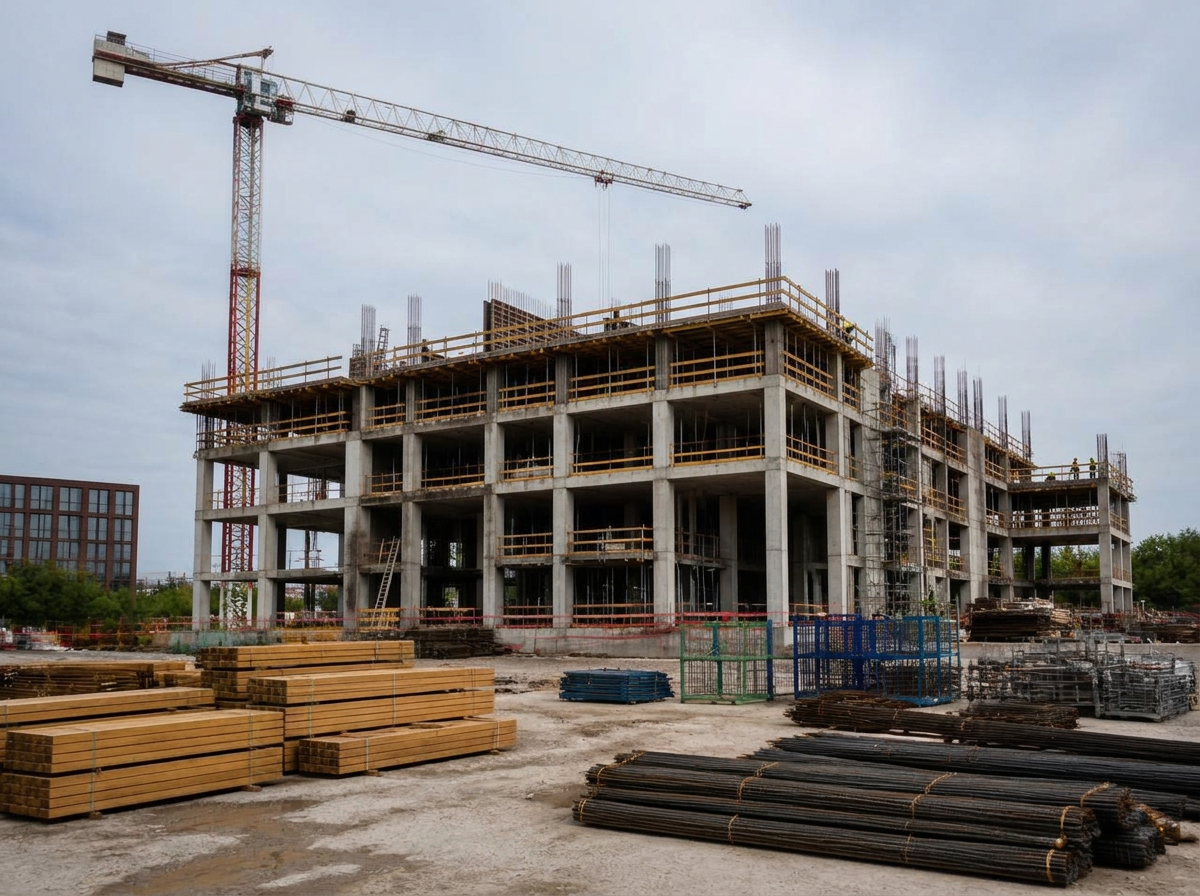
Baseline vs. scan, side by side.
The left photo is what you taught ChangeAIQ. The right one is a later scan, with every change boxed and named on the image itself.
What it detects
Trained on the details of construction.
Progress over time
Week-by-week comparison shows what was built, poured or installed since the last scan.
Material stock
Stacks of timber, pipe and blocks are estimated so you see consumption and loss.
Equipment on site
Machines and tools present in one scan and gone in the next are flagged.
How it works
Four steps, one phone.

Step 1
Pick fixed viewpoints
Choose a few positions on site and photograph them as your baseline.
Step 2
AI reads the site
Structures, stacks and machines are identified in each photo.
Step 3
Repeat weekly
Same spots, same routine — a scan takes a few minutes.
Step 4
Share the timeline
Progress and losses become a dated visual record for client and insurer.
In practice
Write the rule the way you would say it.
Area
Block A east facade
Your rule
"Show me what changed since last week"
Alert
Scaffold extended one level, formwork removed on floor 2.
Area
Material yard
Your rule
"Alert me if machinery leaves the yard overnight"
Alert
Compactor missing from yard since Tuesday's scan.
Area
Delivery bay
Your rule
"Log every delivery visible in the scan"
Alert
New: 4 pipe bundles, 2 pallets of blocks.